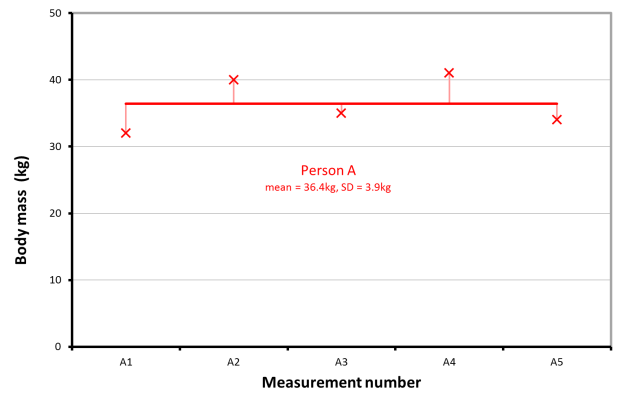
The simplest possible calculation of the SEM is when we have a series of repeat measurements on just one person. In this example the body mass of one person has been measured on five occasions (this chart with the underlying data can be downloaded as an Excel spreadsheet). In the graph below these are plotted as five crosses. The mean value (36.4kg) of those five crosses is plotted as a horizontal line. The five vertical lines represent the deviation of each measurement from the mean. The standard deviation (3.9kg) is a summary measure of how far all the measurements are from the mean. As measurements have only been made on one person the SEM is simply this standard deviation (3.9kg).
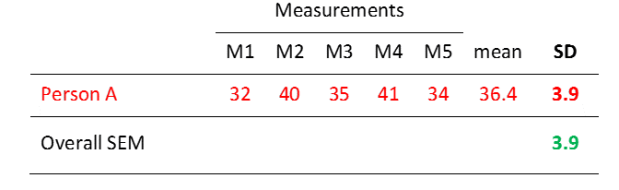
If we want to calculate this using a spreadsheet then the best thing to do is to arrange the measurements in columns and use the relevant spreadsheet functions to calculate the standard deviation.
Next page: Calculating SEM from measurements on more than one person
