normative data

I know him by his gait

I was asked to be an expert witness for a court case last week. There was some video footage from a CCTV camera of an individual walking across a street from some distance away and the question I was being asked to provide an opinion on was, “Is it possible to identify the individual on the basis of his gait pattern?“.

There are, of course a number of University departments working on related issues (that within Computer Vision at the University of Southampton is a good example) and some evidence of commercial interest.  Every so often the concept bubbles into the popular science magazines. (There is now even an Android app that claims to be able to identify a person from the accelerometer data from a smartphone carried in their pocket while they are walking, but that’s another story).

I’ve generally been rather dismissive of these claims. I strip people down to a pair of shorts, stick retro-reflective markers over anatomical landmarks, ask the person to move in a particular fashion along a clearly marked walkway and then capture the movements with ten extremely high resolution cameras pointing directly at them. It often amazes me how little evidence there is of difference from normative reference data even for individuals with quite marked pathology. If I can’t detect such clear differences under such standardised conditions using such specialised equipment how can anyone suggest that they can recognise a healthy  individual, presumably with a gait pattern within the normal range, on the basis of a video image of them walking down the street fully clothed?

And yet in Shakespeare’s Julius Caesar, Cassius says to Casca when he sees a figure approaching, “Tis Cinna. I do know him by his gait“.  In Melbourne my office was by a corridor and it was generally possible to identify which of my colleagues was approaching along it by the sound of their footsteps. Our common experience is that we do recognise people at least partly by their gait. If gait patterns are so characteristic why is it so difficult to pick up abnormality in clinical gait analysis.

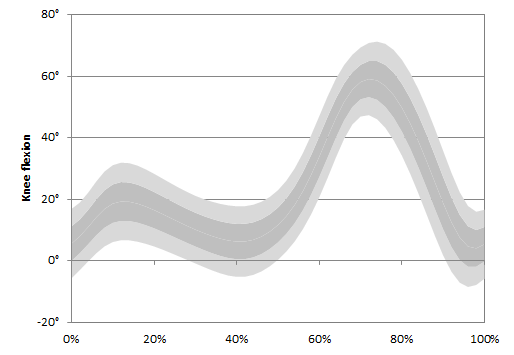
I suspect the answer is partly that gait is so varied and  characteristic. There is much more variability in normal walking than we appreciate. The creation myth of clinical gait analysis is that there is a well-defined pattern of normal walking and that our patients exhibit patterns that differ from this. The longer I think about this idea the less I believe it is true. When we tidy up our normative data by only plotting one standard deviation limits we get reasonably tight normal ranges but this is at the expense of excluding a third of the data (the +/- 1 SD limits only include 67% of the data by definition). If we plot two standard deviations, which represent 95% of the data, then we get much larger bars. Maximum knee extension in stance, for example varies between 5° of hyperextension and 18° of flexion across the healthy population (see figure below).

Knee 2 sd

The reason why it is so difficult to identify gait abnormality among our patients is at least partly because the normal variability between individuals is so large. Maybe on this basis gait as a biometric identifier is not quite so fanciful (although I still have reservations as to whether it will ever work on the basis of CCTV footage recorded in town centres or airports). Perhaps more importantly,  should be studying the characteristics of inter-person variation in gait patterns more closely in order to understand normal walking. In amongst all that variability are there specific characteristics that are invariant? If there are what does that tell us about the requirements of healthy walking? Gait variability within individuals is now seen as providing information about stability and by extension to falls risk (e.g. Callisaya et al. 2011). Maybe we should be paying more attention to gait variability between individuals.

PS Of course the other important factor in recognising people by their gait in every day life is the wide range of information we use to do so. When I recognised people by their footsteps from my office it was probably more to do with the sound that different footwear made as it was to do with temporal-spatial characteristics. One particularly famous CP surgeon was easily identifiable – partly from a mild asymmetry in his footfall pattern but more importantly from the characteristic jangle of coins and or keys in his pocket.

What is normal?

A couple of months ago I wrote a post entitled normative data capture Part 1. No-one has yet demanded Part II but I’ll give it anyway. The earlier post concentrated on what sort of numbers were required to determine normative ranges for any data assuming we want a reasonable estimate of both the average and the standard deviation.

Once we’ve got the numbers sorted out then the question arises “What is normal?” It might be worth starting with a paragraph addressing the political dimension here. The word “normal” is considered inappropriate in some circles because of the connotation that anyone else, our patient for example, is “abnormal” which is considered a negative term. The response from some researchers (particularly Americans?) working with children has thus been to prefer the term typically developing. This presumable implies that our patients our atypical and I’m not sure that that is any better or worse than abnormal.  What I do appreciate is that we are all abnormal in some regard. The question should not be whether the person is normal or abnormal but whether their gait pattern is. I think normative stresses this emphasis that it is the data or the pattern that is abnormal rather than the individual (but others may think differently).

But then what is a normal gait pattern?  In my dictionary there are various definitions of normal and the closest to the sense in which we are using it is not deviating from the standard. Even this though is not particularly close. I suspect that what we really mean is representative of the population. This raises the questions of how we consider people, with conditions such as  cerebral palsy  in relation to this population?  I think that conceptually they should be considered as part of the population. Thus the normal population includes people with cerebral palsy (and other gait disorders). In childhood and early adulthood at least, these conditions are quite rare (approximately 1 in 500 people is born with CP, one of the more common conditions affecting walking) so true normative ranges (calculated over a wide enough sample) would be very little affected by including or excluding them.

Of course we most often collect normative data from much smaller samples (my previous post suggested that 30 might be regarded as a reasonable number). In this case it makes sense to specifically exclude people with obvious neuromusculoskeletal pathology not because we regard them as abnormal in principle but because the statistics of the situation dictate that the normative data that we obtain by excluding them will be closer to normative data for the entire population than the data we would obtain if they were included. (Including one person with CP in a sample of 30 runs the risk of obtaining normative data that is quite different from that which would result from the one person in 500 in the general population)

A more common problem is a number of anatomical and physiological characteristics which have a wide range within the general population such as in and out-toeing, tibial torsion, femoral anteversion, flat-feet and high arches. Some health professionals will want to define an arbitrary and often subjective cut-off beyond which the individual is labelled as having an impairment and exclude them from the normative dataset. I remember hearing one story of a gait analysis service that was interested in providing normative data for a foot model and simply collected a group of individuals who, to them, had no obvious neuromusculoskeletal impairment and were entirely asymptomatic. The team was later joined by another health professional who looked at the dataset and concluded that quite a large proportion of the cohort had either flat feet or raised arches and wanted these abnormal people deleted from the dataset.

This of course raises the prospect of self-fulfilling prophecy. People with flat feet are considered as abnormal because they have data that falls outside the range of those who have been assessed as not having flat feet. This is clearly daft. Normative data ranges should ideally be generated with randomly sampled datasets from the whole population. In practical situations random sampling is extremely rare but it is inappropriate to select participants on the basis of some pre-supposition of what normal is (unless the abnormality is so rare and severe that the inclusion in a small sample risks skewing the data as described above).

There is another problem when we start to look at older populations. Iezzoni et al. (2001) suggest that over 10% of the entire population have some difficulty walking as little as 400m, rising to nearly 50% if we look at the population aged 80 and over. There is considerably potential for inclusion or exclusion of these individuals to affect normative data. If we are concerned with what data to use for comparative purposes in older populations, however, then I think the goal posts have shifted.  What we really require is not normative reference data but reference data from healthy people within a particular age range or more specifically those without any specific neuromusculoskeletal pathology. If we want a convenient shorthand then perhaps we should refer to a healthy gait pattern in these circumstances rather than a normal one.

There are the same risks here of subjective decisions as to where the healthy range ends and pathology starts which are largely unavoidable. These can be addressed to a certain extent by defining explicit and objective inclusion criteria. We might not agree with definitions but at least we will know what they are. Even these are problematic however because it is very easy to introduce sampling bias when recruiting. When selecting healthy controls for a study there will be a tendency to select the healthiest available.  All will fulfil the inclusion criteria but they may not be representative of the population of all people who fulfil those criteria.  The solution here may be to specify the characteristics of the sample that were actually recruited rather than the inclusion criteria for the study.

.

Iezzoni, L. I., McCarthy, E. P., Davis, R. B., & Siebens, H. (2001). Mobility difficulties are not only a problem of old age. Journal of General Internal Medicine, 16(4), 235-243.

Do it yourself normative data comparison (free download!)

Hi, I’ve had a bit of a break over the summer but I’m hoping to start posting again regularly form now on. Just a reminder that we are running another gait course in November (this one focussing on measurement issues rather than clinical interpretation). Click on the image to the right for more details. There is also just about time to register to start our Masters in Clinical Gait Analysis by distance learning (you don’t need to come to Salford at all). Click on the other image to the right for more details of it.

Enough of the ads, this blog following on from one I wrote just after the GCMAS meeting last year. It had a video link to the presentation I’d just delivered arguing that the reason we collect normative data should be so that we can compare it with other people’s normative data. I presented data showing that if we did that for the normative data from the Royal Children’s Hospital in Melbourne and Gillette Children’s Speciality Healthcare then we get quite remarkable agreement. You can see the comparative kinematic data in the figure below.

compare norms

The paper based on that presentation has finally got published in Gait and Posture (if you don’t have access to the journal you can find a pre-publication version here). We’ve also prepared an Excel file that contains the data in a format that allows you to add your own normative data (mean and standard deviation) to allow comparison with the data from Melbourne and Gillette. Just cut and paste your data into the spreadsheet and look at the graphs to see how you compare. Remember that differences in the mean traces suggest that there are systematic differences in how you apply markers, differences in standard deviations are likely to reflect how consistently you apply them within your own lab.

Do let me know how well your data compares. It might be interesting to post some examples of how various clinical centres compare on this blog-site somewhere.

Normative databases: Part 1 – the numbers game

I get quite a few queries from people asking about how they should construct normative databases with which to compare their measurements. The first question to address is what you want the normative database for. As you’ll read in my book or in a paper that has just been accepted for Gait and Posture (based on the paper I presented at GMCAS last year)  I’m not convinced by the traditional arguments that we all have different ways of doing things and that we need to compensate for this by comparing clinical data to our own normative data. The whole history of measurement science, which really started at the time of the French revolution, has been about standardisation and the need to make measurements the same way. I don’t see any reason why gait analysts should be allowed to opt out of this.

I’d suggest that the main reason for collecting normative data should be to demonstrate that our measurement procedures are similar to those used in other labs rather than to make up for the idiosyncrasies that have developed for whatever reasons. Our paper shows that there are very small differences in normative data from two of the best respected children’s gait analysis services on different sides of the planet (Gillette Children’s Speciality Healthcare in Minneapolis and the Royal Children’s Hospital in Melbourne). The paper should be available electronically very soon (a couple of weeks) and will include the two normative datasets (mean and standard deviations) for others to download and compare with.

There are two important elements for comparison. Differences between the mean traces of two normative datasets will represent a combination of systematic differences between the participants and between the measuring techniques in different centres. If you find large differences here you should compare detailed description of your technique with that from the comparison centre and try and work towards more consistent techniques. Differences in the standard deviations represent differences in variability in the participants and in the measurement techniques. High standard deviations are likely to represent inconsistent measurement techniques within a given centre and require work within the centre to try and reduce this.

Having defined why we want to collect the data you can then think about how to design the dataset. The most obvious question is how many participants to include? The 95% confidence limits of the mean trace are very close to twice the standard error of the mean which is the standard deviation divided by the the square root of the sample size. I’ve plotted this on the figure below (the blue line). Thus if you want 95% confidence that your mean is within 2° of the value you have measured you’ll need just under 40 in the sample. If you want to decrease this to 1° you’ll need to increase the number to about 130. I’d suggest this isn’t a very good return for the extra hassle in including all those extra people.

sample size for normative data collection

Calculating confidence limits on the standard deviations is a little different (but not a great deal more complicated) because they are drawn from a chi-distribution rather than a normal distribution (see Stratford and Goldsmith, 1997). We’re not really interested in the lower confidence limit (how consistent our measurements might be in a best case scenario) but on the upper confidence limit (how inconsistent they might be in the worst case). We can plot a similar graph (based on the true value of the standard deviation being 6°). It is actually quite similar to the mean with just over 30 participants required to have 95% confidence that the actual SD is within 2 degrees of the measured SD and just under a hundred to reduce this to 1°.

In summary aiming to have between 30 and 40 people in the normative dataset appears to give reasonably tight confidence intervals on your data without requiring completely impractical numbers for data collection. You should note from both these curves that if you drop below about 20 participants then there is quite high potential that your results will not be representative of the population you have sampled from.

That’s probably enough for one post – I’ll maybe address some of the issues about the population you should sample from in the next post.

Just a note on the three day course we are running in June. Places are filling up and if you want to book one you should do so soon.

.

Stratford, P. W., & Goldsmith, C. H. (1997). Use of the standard error as a reliability index of interest: An applied example using elbow flexor strength data. Physical Therapy, 77, 745-750.


Why do we collect normative data?

The sun is still shining in Cincinnati although many of us in the conference hotel are seeing very little of it. Thought I’d share the podium presentation I’ve just made which reflects on why it is that we collect service specific normative reference data. It’s my feeling  that this should be to allow us to compare data between services in order to develop consistent practices rather than as a way to allow us to continue to tolerate differences in the way different services make measurements. Anyway if you want to you can listen to the screen cast below.

There was an interesting technical extension to the work which I was unable to include in the presentation because of tht time limit. This is covered in the screen cast below.