There were a few things that struck me as odd when I was writing my book. Things that we’ve always done in a particular way in clinical gait analysis but which just don’t make sense. One of these is the way we typically “normalise” kinetic data by dividing through by mass only. Moments are a product of force and length and are thus likely to be influenced both by a person’s weight and their size. It just doesn’t make sense to normalise data by dividing through by weight only. There are similar, but slightly more complex, issues with joint power. Differences in adult height between individuals, expressed as a percentage, tend to be reasonably small (SD < 10%) even disregarding gender, so the effects of not normalising to height in adults are unlikely to be that important. Clinical gait analysis, however, has always had a considerable focus on children where differences in height are much larger. It just seems so obvious that we should normalise to height as well as weight. In my book I see that I actually commented, “Quite why this is not standard practice in gait analysis is unclear.”
A simple explanation may be that no-one has ever tested this assumption. So one of my colleagues (Ornella Pinzone) has performed a comparison of conventional normalisation (dividing moments and powers by mass only) and non-dimensional normalisation (dividing moments by mass and leg length and powers using a slightly more complex formula). We based it on data made available by Mike Schwartz from Gillette as their data are so well formatted for a study like this. The paper has just been published in Gait and Posture and if you use this link before 29th January then you should be able to view and download a copy of the article for free.

Coefficients of determination for relationship between a range of temporal, spatial and kinetic parameters and age amongst children across an age range from 4 to 18 years. Dashed line shows threshold for statistical significance at p<0.05.
The results are quite conclusive. About 80% of the associations between the conventionally normalised parameters and age, height and weight, were statistically significant (p<0.05) and for all of those parameters where the association was significant it was substantially reduced by non-dimensional normalisation (only just over 20% were statistically significant and most only marginally exceeded the p<0.05 threshold). The results have dispelled any lingering doubts in my mind as to the superiority of non-dimensional normalisation and when we next revise our normative dataset we’ll be using this as standard.
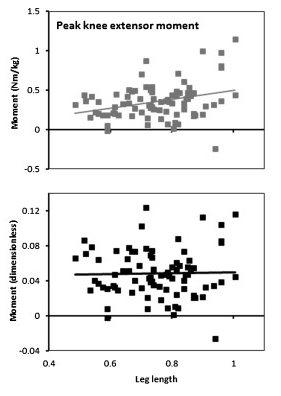
This isn’t quite the whole story, however, because even when you remove the systematic effects of height and weight (this is the primary purpose of normalisation) there is still a lot of scatter in the data. The figure below shows the relationship of peak knee extensor moment with leg length for conventional (top) and non-dimensional (bottom) normalisation. The slope on the line of regression is reduced to almost zero with non-dimensional normalisation but there is minimal effect on the scatter of data points about this line.

Peak knee extensor moment plotted against leg length for conventional (top) and non-dimensional (bottom) normalisation.
It is difficult to compare this variability with that present in kinematic data because the nature of the data is so different but the impression I get is that the variability in the kinetic data is even greater than that in the kinematic data. I’ve commented in two earlier posts (here and here) that I think the assumption that we all walk similarly, an assumption on which all clinical gait analysis is based, needs to be re-examined. The most obvious conclusion from this dataset is that many of us, even in the absence of pathology, walk very differently.
