To know the true value of the SEM we would have to repeat every measurement we make and include it in an analysis as outlined above. This is clearly impractical and instead we perform a repeatability study making a specified number of measurements on specified number of people. The result of this study, however, can only be regarded as an estimate of the true value, which might be bigger or smaller. The main reason for calculating these values, however is to make sure that the variability of our measurements is not too big and that we are not attributing anything of clinical significance to what is more probably an artefact of the measurement process. We are thus only really interested in how much bigger than our estimate the true value might be, it is of little consequence that it might be smaller. We can give an indication of the certainty of our estimate of the SEM by specifying the upper limit that it might have. By convention we specify the upper 95% confidence limit. To understand what this means then imagine that we perform 100 similar studies (on different people). In 95 of those studies the true SEM will lie below this value.
The process for determining the upper 95% confidence limit requires some knowledge of statistics (see this page if you are interested) but the result is quite simple. It turns out that the upper 95% confidence limits can be calculated by multiplying the estimated SEM by a number (the multiplying factor) that depends on the number of people who have been measured and the number of measurements that have been taken from each (see Table below).
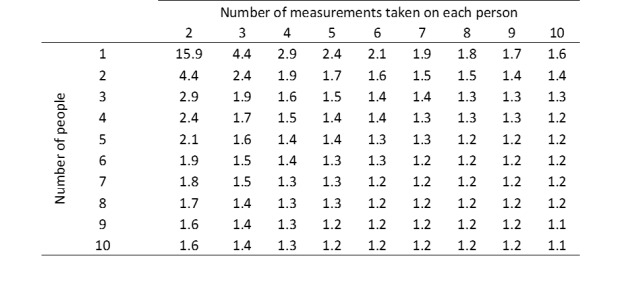
Thus if you conduct a repeatability study in which you make 3 measurements on each of 4 people you will need to multiply the calculated SEM by 1.7 to obtain the upper 95% confidence limit. You can see that the numbers are always greater than 1 which means that the upper 95% confidence limit is always greater than then estimated SEM. You can also see that the more measurements you take (whether by repeating measurements more or using more people) the closer the value gets to 1.0 which means that the 95% confidence limit is closer to the calculated SEM (in other words you are more confident in the value you have calculated).
The size of the multiplying factors is also important. You can see that the multiplying factors can be very large if the total number of measurements is small. Thus if you make just two measurements on two people the true SEM could be as much as 4.4 times the calculated value. If we assume that there is not much pointing in performing a study in which the upper 95% confidence limit is more than twice the calculated value (i.e. the multiplying factor is greater than 2) then you can see that we need to make at least 2 measurements on 6 people, 3 measurements on 3 people or 4 measurements on 2 people. This can be regarded as the minimum size for any meaningful repeatability study (the sort that might be conducted as part of routine quality assurance purposes within a clinical service).
You can also see that as the total number if measurements increases that the added benefit of doing more measurements diminishes. Thus in going from a total of about 40 measurements (e.g. 4 people x 10 measurements, 5 people x 8 measurements) to a total of 100 measurements (e.g. 10 people x 10 measurements) the multiplying factor only drops from about 1.3 or 1.1. There is thus little to be gained by performing very large repeatability studies. A sensible compromise for studies seeking to establish the variability of measurement techniques for publication purposes would probably be to aim for a multiplying factor of around 1.5 (e.g. 6 people x 3 measurements, 4 people x 4 measurements etc.).
It should be noted that this table only relates to the SEM. Subsequent sections will describe a number of other parameters that can be generated from repeatability studies. The multiplying factors for these will be different and will generally be larger than those in the Table above.
Next page: Measurements made by different assessors
