This post was stimulated by a presentation given to the GCMAS by Nancy Lennon of the A.I. Du Pont Hospital in Delaware. She presented data on measured activity levels over the year following major orthopaedic surgery for children with cerebral palsy. Her data came from a case study and showed how the patient’s activity levels fell markedly at 3 months after surgery before picking up through the rest of the post-operative year.
The graph below is an update of one I prepared for a lecture on Outcome Measures at the Melbourne Gait Courses last year. It puts together data from a range of sources to suggest a time history for the Gross Motor Function Measure (GMFM, Russell et al., 1989) for a child with cerebral palsy who has single event multi-level surgery (SEMLS) at the age of 10. The data points are taken from Thomason et al (2013) and represent average GMFM scores for a cohort of children at baseline (blue) and 12, 24 and 60 months (green) following SEMLS. Before surgery I’ve assumed that the data follows the latest GMFM curves (Hanna et al., 2009) to arrive at the baseline value.
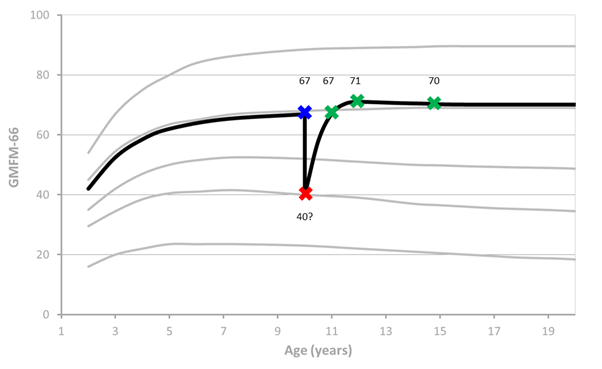
The red point is invented. It is an estimate of the GMFM a child might record if assessed on coming round after surgery in a hospital bed with below knee casts. The actual value is not particularly important but seems reasonable when I glance through the GMFM manual. I’ve then extrapolated the curve from this point through 12, 24 and 60 month data points. Having seen the videos of kids coming back for 3, 6 and 9 month follow-up after such surgery whilst in Melbourne I don’t think the time course over the first year is too far away from reality. I’ve finished off the curve assuming that it follows the known GMFM data (Hana et al., 2009).
First thing to point out is that average GMFM score at one year is almost exactly the same as at baseline and the maximum GMFM is recorded at two years following surgery suggesting that the one year follow-up may be a little early to assess outcomes.
The point I really want to make though is that if you look at this graph the biggest feature is not the improvement from pre-op to 12 or 24 month status. It is the drop in function immediately after surgery and the improvement back to baseline at 12 months. This has the potential to impact on patient, family and clinical perceptions of outcomes. If the dominant memory of the surgery is of the condition the child was in immediately afterwards, then the perception may well be of the change following surgery as being represented by the difference between the green points and the red point which might lead to a much more positive view of outcomes than a more scientific comparison with the blue point. Particular caution may have to be exercised in interpreting the results of subjective or semi-subjective assessments such as heath related quality of life questionnaires or informal assessment of outcomes.
Final point is that there are a multitude of reasons for performing such surgery and assessing outcomes on the basis of any one measure in isolation is inappropriate. I’ve plotted this data to make a particular point about the time course of recovery not to make any general conclusions about the effectiveness of the surgery. Gait Profile Scores (Baker et al., 2009) reflecting the quality of the gait pattern improved by over 30% in the same cohort for example.
.
Russell, D. J., Rosenbaum, P. L., Cadman, D. T., Gowland, C., Hardy, S., & Jarvis, S. (1989). The Gross Motor Function Measure: a means to evaluate the effects of physical therapy. Developmental Medicine and Child Neurology, 31(3), 341-352.
Thomason, P., Selber, P., & Graham, H. K. (2013). Single Event Multilevel Surgery in children with bilateral spastic cerebral palsy: a 5 year prospective cohort study. Gait Posture, 37(1), 23-28.
Hanna, S. E., Rosenbaum, P. L., Bartlett, D. J., Palisano, R. J., Walter, S. D., Avery, L., & Russell, D. J. (2009). Stability and decline in gross motor function among children and youth with cerebral palsy aged 2 to 21 years. Dev Med Child Neurol, 51(4), 295-302.
Baker, R., McGinley, J. L., Schwartz, M. H., Beynon, S., Rozumalski, A., Graham, H. K., & Tirosh, O. (2009). The gait profile score and movement analysis profile. Gait Posture, 30(3), 265-269.
