Which bump does what?

There was some discussion at the CMAS meeting in Glasgow last week about what causes the characteristic bumps in the vertical component of the ground reaction. Before you read on it might be worth just stopping to think this through for yourself. Working from the premise that Newton declared that if there is a net force acting on an object then it must be accelerating – which acceleration does the first bump represent and which bump does the second represent?

Several of us admitted to believing that the prevailing wisdom (“what the textbooks say”) is that the first bump represents a deceleration of the centre of mass as it’s downwards movement is arrested and that the second bump is the upwards acceleration as we push off. This is not the correct explanation as Barry Meadows made clear in his presentation.

I’ve plotted some idealised data below to illustrate what is actually happening. The ground reaction under the left limb is represented in red and that under the right limb in right. One thing we  should do more often is to plot the sum of these which of course is the total force acting on the body (Chris Kirtley does do this in his book, 2006). The first interesting thing to note is that the peak total ground reaction actually occurs just before the middle of double support where two relatively modest forces from the different limbs superimpose.

GR and COM

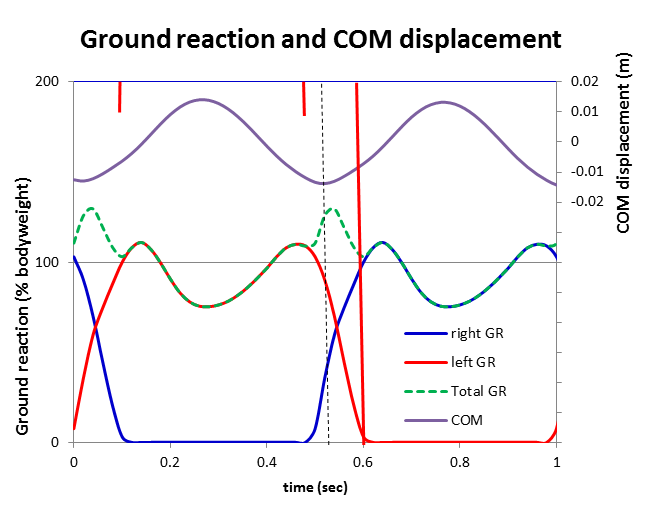
I’ve also plotted the trajectory of the centre of mass (calculated from a double integration of the total ground reaction). It is at its highest in middle single support and lowest in early double support. The dotted black line shows its minimum value. Before this point the COM is travelling downwards and being decelerated and afterwards it is travelling upwards and being accelerated. Thus the first bump of the ground reaction is acting to accelerate the body upwards and the second bump is acting to decelerate as it falls from its peak height during middle single support. This is the opposite to “what the text books say”.

Or are we being unfair to the text books? I’ve gone back to see.

Whittle (2012) and Kaufman and Davis (writing in Rose and Gamble, 2006) get the explanation spot on.

Gage(2009, p54), on the other hand, states that the “body has been accelerating by gravity as it fell from its zenith at mid-stance to its nadir at loading response. As  a result the total force on the limb as it impacts the floor is about 120% of body weight“. This is a bit vague but essentially wrong. The body has actually been decelerating for half of its fall from zenith to nadir such that the vertical component of its speed is virtually zero at foot contact. The first peak of the ground reaction occurs well after the limb impacts the floor and is a result of the centre of mass being accelerated upwards.

Perry (2010, p459) writes that “the first peak (F1) … is increased above bodyweight by the acceleration of the rapid drop of the body mass”. This is also wrong-  the deceleration of the body mass is almost complete by initial contact and has occurred as a consequence of the GR under the trailing limb. The description of the second peak is even more confused – “the second peak (F3) … is modified by the push of the ankle plantar flexor muscles against the floor in addition to the downward acceleration of the COG as the bodyweight falls forwards over the forefoot rocker“.

So there we have it on a random sample of four books that happen to be on my shelf this afternoon two have the explanation correct and two have it essentially wrong.

There is some additional confusion because the fore-aft component of the ground reaction actually has the opposite effect.  In the first half of stance the GR is acting to decelerate the body in a horizontal direction (at the same time as accelerating it in an upwards direction). In the second half of stance the opposite is occurring as the GR is accelerating the body forwards (at the same time as it is decelerating it as it falls vertically).

.

Kirtley, C. (2006). Clinical gait analysis (1st ed.). Edinburgh: Elsevier

Levine, D., Richards, J., & Whittle, M. W. (2012). Whittle’s Gait Analysis (5th ed.): Churchill Livingstone.

Rose, J., & Gamble, J. (Eds.). (2006). Human Walking (3rd ed.). Philadelphia: Lippincott Williams and Wilkins.

Perry, J., & Burnfield, J. M. (2010). Gait analysis: normal and pathological function (2nd ed.). Pomona, California: Slack.

Gage, J. R., Schwartz, M. H., Koop, S. E., & Novacheck, T. F. (2009). The identification and treatment of gait problems in cerebral palsy (1st ed.). London: Mac Keith Press.

Re recycling terminology

My second post on this blog was a suggestion that, when you think about it in detail, there are some problems with the conventional terminology that clinical gait analysts use to divide the gait cycle into phases and that a very simple scheme based upon simple division of the gait cycle into single support, double support and swing might have some advantages. Here is a video I’ve developed to help gait analysts reflect on the issues.

Averaging up the profits

Here are two graphs. The first from very early in my career shows a parameter we called the “dynamic component” of gastrocnemius length. It plots the improvement in this after injection of botulinum toxin in children with cerebral palsy against the baseline score (Eames et al., 1999). I remember when Niall first showed me the graph. We’d captured a  whole load of data on these kids and were wondering what to plot to make sense of it. This was the first suggestion and I can still remember Niall’s excitement when it came up with such a strong relationship.

Eames

At the other end of my career here’s another graph from a paper that has only just been published electronically in Gait and Posture (Rutz et al. 2013). Here is the improvement in Gait Profile Score (GPS, Baker et al., 2009) for children with cerebral palsy plotted against baseline score (with GMFCS II and III children plotted separately). Again there is a strong correlation. (There are some statistical issues in plotting data this way which might lead to exaggeration of the correlation when measurement error is substantial but I’ve gone to some lengths in the recent paper to show that this is unlikely.)

rutz

When you think about it though the relationship is actually quite unremarkable. What both studies are showing is that kids with the most severe problems to start with are the most likely to show improvements. To a certain extent this is common sense – if two kids both improve by 30% then the child with the biggest problem to start with will show the biggest change in absolute units.

What interests me though is that if we only look at the average changes in each group we will reach the conclusion that the group as a whole have improved. If we are not careful we might conclude that all the group has improved. Thissimply isn’t the case. The full truth is that the kids who have the biggest problems have improved a lot those with milder problems haven’t improved very much (in absolute terms).

The Botulinum toxin study became the basis for an industry sponsored randomised controlled trial (Baker et al. , 2002). In that trial although we included baseline readings as a covariate in the statistical analysis but we only ever reported group results. That is still probably the most rigorous trials of lower limb injection of Botulinum Toxin in the literature. The message that almost everyone has taken out of that study  from the data we presented is that kids with spastic diplegia will benefit form Botulinum toxin. Had we presented the data more carefully the conclusion should have been that the more severely affected kids will benefit from Botulinum Toxin big time, but that  the milder kids may not benefit at all.

As it stands the paper is really convenient for the company because it suggests that a wider group of kids will benefit from an expensive drug than is actually the case. Given that bigger responses to treatment in more severely affected people is likely in almost all conditions that affect people across a range of severity I suspect that a similar phenomena spread across almost all of . I wonder how much profit the drug companies are making as a consequence?

Leave a comment or double click “n comments” link at top of post to view discussion.

Baker, R., Jasinski, M., Maciag-Tymecka, I., Michalowska-Mrozek, J., Bonikowski, M., Carr, L., . . . Cosgrove, A. (2002). Botulinum toxin treatment of spasticity in diplegic cerebral palsy: a randomized, double-blind, placebo-controlled, dose-ranging study. Dev Med Child Neurol, 44(10), 666-675.

Baker, R., McGinley, J. L., Schwartz, M. H., Beynon, S., Rozumalski, A., Graham, H. K., & Tirosh, O. (2009). The gait profile score and movement analysis profile. Gait Posture, 30(3), 265-269.

Eames, N. W. A., Baker, R., Hill, N., Graham, K., Taylor, T., & Cosgrove, A. (1999). The effect of botulinum toxin A on gastrocnemius length: magnitude and duration of response. Dev Med Child Neurol, 41(4), 226-232.

Rutz, E., Donath, S., Tirosh, O., Graham, H.K., Baker, R. (2003). Explaining the variability improvements in gait quality as a result of single event multi-level surgery in cerebral palsy. Gait Posture, published on-line http://dx.doi.org/10.1016/j.gaitpost.2013.01.014

Goldilocks Biomechanics

I’m working on a variety of learning materials to teach clinical gait analysis at the moment. Our masters programme in clinical gait analysis should start in 8 months time. One thing I find really depressing is how little of our clinical reasoning for individual patients is based on biomechanics. Most of the interpretation we do is essentially learned and largely subjective pattern recognition. We don’t really understand the data in a way that approaches science.

goldilocks

There are numerous reasons for this but one of the issues is that the biomechanics of walking is not being developed at the right level. On the one hand we have a group of researchers, coalescing under the Dynamic Walking Group, who are developing extremely simple and often non-physiological models to explore very basic principles. On the other hand are researchers typified by (but not restricted to) the OpenSim project who are developing really complex computer models. Neither group, as far as I can see is having a significant impact on the clinical understanding of gait or affecting how we manage our patient’s conditions.

To my mind the simple models are just too simple – how do you use a model without muscles to understand the consequences of a spastic gasttrocnemius? Equally the complex models are too complex- it’s impractical to perform a full CMC analysis for every patient. Even if we did we wouldn’t know which results are robust indications of the biomechanics of the patient and which are consequences of modelling assumptions and parameters.

What we really need is models that are neither too simple nor too complex – borrowing from modern astrophysics we need them to inhabit the Goldilocks zone – Goldilocks biomechanics.

Why do we so rarely test normalisation schemes?

Normalising gait data is so common that we may sometimes forget about why we are doing it. It’s getting on for 17 years since At Hof published his paper on non-dimensional normalisation (Hof, 1996). Slowly this approach is being becoming part of mainstream practice. What interests me, however, is how little testing to check that it actually works.

Normalisation is a technique to try and reduce the variability in data that comes when individuals of different sizes are being compared. A raw measure of joint moment in Newton-metres, for example, is likely to be greater in a heavier person simply because they are heavier. Measurements of joint moments across a range of people are likely to be vary considerably simply because those people are of different weights. By dividing all the measurements by bodymass and reporting measurements in N-m/kg we hope to reduce the variability. This should make it much easier to spot a subject who has abnormal moments because of the way they walk rather than how heavy they are.

At introduced a hypothesis that a particular way of normalising data to give non-dimensional values would reduce the variability in data. This is an extremely sensible approach but it is essentially a hypothesis. Given this it is interesting that there has been so little work to test the hypothesis. Ben Stansfield (2003) and colleagues in Edinburgh tested how non-dimensional normalisation affected a correlations between a range of temporal and spatial parameters with impressive results but didn’t actually address the even more basic question of how whether the normalisation reduces the variability with body size (which is what it is designed for as described above).

Oxygen normalisation

Adapted from Schwartz et al., 2006

Mike Schwartz and I (Schwartz et al., 2006) adopted the approach for normalising oxygen cost and rate/consumption. The traditional approach was simply to divide Oxygen cost by mass and when we tested this we found that the data was over-normalised. Raw measurements (mmO2/m) increase with increasing weight. Measures normalised by bodymass (mmO2/kg-m) actually decrease with increasing mass (see Figure below). Deriving a non-dimensional equivalent results in data that show no systematic variation with mass, height or age. When we did this paper I think we assumed that other people might investigate other normalisation schemes in a similar manner but, to my knowledge there have been no such studies.

Two obvious candidates for such studies are joint moments and powers. Dividing either by mass alone (as is almost universal practice in clinical gait analysis) only partially normalises the data. Hof recommends that moment should be normalised by leg length as well as mass (and this is common practice in some strands of research particularly studies of the knee adduction moment). It really is quite amazing that over three decades after David Winter popularised the use of joint moments in clinical gait analysis (Winter & Robertson, 1978) no-one yet has performed a definitive study to identify the optimum normalisation scheme for the data.

Hof, A. (1996). Scaling gait data to body size. Gait and Posture, 4, 222-223.

Schwartz, M. H., Koop, S. E., Bourke, J. L., & Baker, R. (2006). A nondimensional normalization scheme for oxygen utilization data. Gait Posture, 24(1), 14-22.

Stansfield, B. W., Hillman, S. J., Hazlewood, M. E., Lawson, A. M., Mann, A. M., Loudon, I. R., & Robb, J. E. (2003). Normalisation of gait data in children. Gait Posture, 17(1), 81-87.

Winter, D., & Robertson, D. (1978). Joint torque and energy patterns in normal gait. Biological Cybernetics, 29, 137-142.