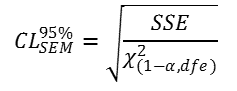
This approach is based upon that outlined by Stratford and Goldsmith [2] which is itself based on the work of Armitage and Berry [p221-223 in 3rd edition]. It is based on the assumption that the variance (square of the standard deviation) can be assumed to be distributed with a chi-squared distribution. In this case the upper 95% confidence limit of the variance can be expressed as:

Where SSE is the sum of squared errors as calculated from the ANOVA table and and the denominator represents the chi-squared value for the probability level of α and dfe degrees of freedom.
The SEM is the square root of the variance and its upper 95% confidence limit ( ) will thus be given by:
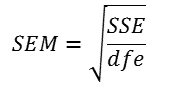
The SEM is derived from the SSE, however, using:
and thus the earlier equation can be written as:
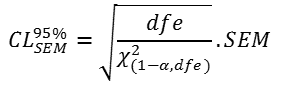
Giving a multiplying factor (MF) of:

The degrees of freedom are given by:
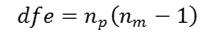
where np is the number of people and nm is the number of measurements made on each person. For the upper 95% confidence interval 1-α will be 0.05.
Note a subtle point that this is the upper 95% confidence limit not the upper limit of the 95% confidence interval as suggested by Stratford and Goldsmith. This is based on the argument that the lower limit is not all that important (and is equivalent to the choice between using a one-tailed rather than two tailed distribution for a t-test). Following Stratford and Goldsmith would result in values that are substantially larger if the degrees of freedom are very small but makes little difference for more typical studies.
Table one has been generated in this Excel spreadsheet using the function:
MF = SQRT(dfe/CHISQ.INV(0.05,dfe)).
