biomechanics

Clearing the air

Every so often I’m asked about why we tend to do clinical gait analysis barefoot and in AFOs (and shoes). One answer is that the barefoot condition tends to give a better indication of the full extent of a patient’s problems whereas walking in AFOs may be a better indication of how they function in everyday life. Another, however, is that sometimes walking in AFOs can help in identifying which particular impairments are having the most effect on gait. This was certainly the case when, a couple of weeks ago, I was reviewing one of the case studies we often use for teaching purposes but which exhibited features that I had not previously understood.

The analysis is of a seven year old girl with diplegic cerebral palsy (GMFCS III). She can take a few steps unaided but normally walks with a K-walker. We actually tested her in and out of the K-walker barefoot and in shoes and AFOs. the K-walker didn’t make that much difference to the kinematics with either condition so we’ll focus on the two unassisted walking conditions.

toe-walking-graphs

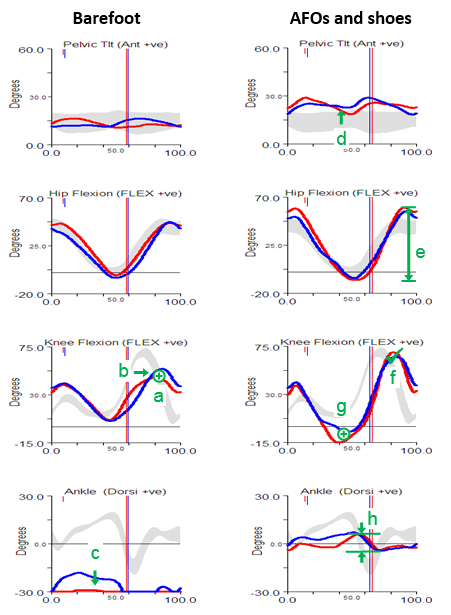
Perhaps the most obvious feature of the barefoot data is that she walks right up on her toes in considerable plantarflexion (feature c). The physical examination data shows that plantarflexor contractures (no passive dorsiflexion with knees extended beyond 10° plantarflexion ) can account for some of this but there are also signs of spasticity (from modified Tardieu and Ashworth tests). There is also, however, some suggestion of late (feature b) and reduced (feature a) knee flexion in swing. There is no clear explanation of this from the physical exam although there is a response to the Duncan-Ely test when performed quickly which might indicate some rectus femoris spasticity. Along with these specific findings the assessment indicates generalised weakness, persistent bilateral femoral neck anteversion and some mild tightness of the hip flexors.

The gait analysis with AFOs is quite different. The solid AFOs cast in a neutral position (which might have been assumed to be too aggressive given the physical examination) do appear to be holding the ankle in neutral  and substantially limit movement at the ankle (feature h).  The pelvis is a little more anteriorly tilted (feature d), possibly to move the centre of mass anteriorly as the new sagittal plane foot alignment will move the centre of pressure anteriorly (the steps were too short to get reliable kinetics). This would also exert a greater external extending moment at the knee which accounts for the hyperextension in late stance (feature g). The increased pelvic tilt leads to increased maximum hip flexion whereas the hyperextension pushes the knee back and maintains maximum peak hip extension. The overall effect is an increased range of movement at the hip (feature e). Perhaps most interestingly though, given that there is a question as to whether the rectus is spastic or not, is that peak knee flexion in swing is essentially normal (feature f). The slope of the knee graph through toe off is if anything a little steeper than normal. Such free flexion of the knee suggests that rectus spasticity is not a problem. Peak knee flexion is still delayed but this is clearly seen to be a consequence of the knee being too extended as it starts to flex in middle single support rather than of any stiffness. In summary, the data from the barefoot condition is inconclusive as to whether rectus femoris spasticity is contributing to the gait pattern but the data from the AFO condition provides quite strong evidence that it is not.

I hope that this has answered the question I posed at the beginning of this post but it does prompt another question – if there is no rectus spasticity then why is peak knee flexion so reduced in the barefoot condition?

I think the answer to this may lie in the observation that if a person is walking on their toes (and in plantarflexion) then it actually requires considerably less knee flexion for clearance in swing than in normal walking. In other words this girl may be showing reduced knee flexion in swing simply because she doesn’t need it when walking barefoot not because there is anything wrong with her knee function.In AFOs the ankle is held in neutral which makes clearance much more difficult and she has no option but to flex the knee more. It is interesting to note that when walking with shoes and AFOs she walks 20% slower than in bare feet and looks considerably less stable and fluent in her movements.

Rather than waste a lot of text in trying to explain why this occurs I’ve recorded a short video using Verne to illustrate that this is the case.

I go into the underlying concepts in relation to normal gait in this screen cast and have explored some of the other consequences of this for those walking in a more crouched gait pattern in this video blog.

Can the ground reaction move for you? (competition with small prize)

Thought I’d do something different and run a little competition with the chance of winning a copy of  my book. It’s based on one of the learning exercises we give to our students on our Masters in Clinical Gait Analysis by distance learning  If you’ve got students, trainees or junior colleagues maybe you’d like to forward the URL of this post to them so that they can have a go. Our students enjoy the exercise and I assume they will too. They also learn a lot about how we walk and how to measure the ground reaction.

This exercise requires students to experiment with walking in different ways to modify the characteristics of the ground reaction. You can download  a full description here. First of all they are simply asked to walk at different speeds and record the ground reaction. They then compare the data with those in Mike Schwartz’s paper on how gait patterns in general vary with walking speed. Generally there is good agreement but occasionally we’ll find someone who doesn’t vary speed in the same way that the average person does (whoever that is!).

Then I give them a number of different graphs of theoretical ground reactions and ask them to try and walk in such a way that they match the shape of the graph. The two below, for example, are to walk with exaggerated peaks of the vertical component and then with a flat pattern.

GRF 1GRF 2

The students generally find these reasonably easy. The more alert ones spot that the flat pattern is simply what you get if you walk slowly but it can be reproduced in a normal speed walk if you think about what you are doing..

Then  come two more – one with the first peak higher than the second and finally the second peak higher than the first.

GRF 3GRF 4

Again the first is easy. It is what happens if you walk faster (but like the flat peaks there are also ways of recreating it at normal speed). The second is much harder and so far (over two years now) none of the students has come up with a convincing example of walking with a higher second peak than first.

This interests me because a few years ago Barry Meadows and some of his colleagues published a paper based on their observation that in patients with a wide range pathologies you almost always find that the second peak of the ground reaction is diminished – never the opposite. They called this Ben Lomonding, after a mountain in Scotland that has two peaks – one of which is higher than the other.

Ben Lomond

So I just wonder – is it possible to walk in this way? I’m prepared to offer a copy of my book (signed of course!) for the person who can provide the best version of the fourth graph above (2nd ground reaction considerably higher than the first) as real ground reaction data.

Part of the aim of the learning exercise is for students to think about the relationship between the ground reaction and the movement of the centre of mass and we ask them to explain how they have changed their walking pattern in order to alter the  ground reaction.

I suspect it will be a lot easier if you adopt a highly asymmetrical pattern or adjust your gait for the particular step when you hit the force plate. I’ll be more much more impressed if you can illustrate the phenomenon with a symmetrical, repeatable gait pattern.

I’ll use these last two criteria (convincing explanation, and repeatability and symmetry of gait) to judge the winner in the event that more than one person comes up with a solution.

Maybe we need a few rules. Two weeks feels like about the right time. Send entries to me (r.j.baker@salford.ac.uk) by midnight (UK time) on Monday 29th February. They should include:

  • a graph of the vertical component of the ground reaction (you might want to include the GRF from both legs if you want to impress me with your symmetry)
  • a video of you walking over the force plate (or you could send a link to one you’ve uploaded to YouTube of Vimeo or somewhere else publicly accessible – this is what I encourage our students to do). These are particularly useful if you can overlay the ground reaction vector but  I won’t insist on this as a lot of people still don’t have the technology (if all you’ve got is a smart phone then use that). Try and capture at least one step before and one step after the measurement if you want to impress me with the repeatability of your gait pattern).
  • a biomechanical explanation of how you have changed your walking pattern in order to change the ground reaction in this way.

To ensure that entries are genuine I will be try to replicate the best entries in my lab here on the basis of the explanations provided. If I can’t do this I may ask for proof that the data is real (e.g. data in a .c3d other file format that has obviously come directly from a force plate).

I’ll assume that in submitting these you’ll be happy for me to use the graphs and video  in a future post reporting the results. (Note that I won’t publish the explanations – I feel people should be free to write what they want without fear that it will get posted publicly).

Finally, if you enjoy the exercise and would like to engage more, why not think about enrolling on the Masters programme. You can do it as part time study in your current workplace and do not need to travel to Salford at all. You can find details at this link.


Power to the planes?

I’ve just noticed that my blog is still displaying its Christmas card which feels a bit poor as we move into February. Thought I’d reflect on an issue that came up just before Christmas when we were looking at some joint power data from a cohort of amputees. My colleague first presented the data in “components” in the different planes. I commented that I regarded this as wrong and asked her to plot out the total joint power. She came back to me a little later to say that she couldn’t see how to compute this directly within Visual3D.  This caused us to look at their wicki which appeared to confirm what she had found with an explanation that this is how joint power was presented in Move3D, the software out of which Visual3D evolved, and that this “has become common in the biomechanics community”. My initial reaction was that “common in the biomechanics community” does not necessarily correlate with “correct”. To do Visual3D justice, the wicki also points out that you can calculate total power from its “components” but not vice versa which at least makes sense, even if you question how appropriate it is to refer to these as “components” . (Rather bizarrely feedback from C-motion after publication of this post makes it clear that a JOINT POWER SCALAR function has been available in the software for quite a long time as well as the original calculation of “components” and it was the wicki that was/is misleading! The original wording of this paragraph has been modified in acknowledgement of this).

Knee power

The confusion is quite widespread. When Vicon first produced Polygon it only allowed a graphing of total power and then one day I noticed an option to plot the different “components”. I dropped them an e-mail pointing out the mistake and was told that it wasn’t a mistake but a feature that a number of their customers had requested. It was clear that consumer demand was a more important driver of product development than the rigour of the biomechanics!

So what is the issue? As defined in physics, power is what we call a scalar, it cannot be related to any particular direction or plane. Think of it as a bit like your age, another scalar, it doesn’t really make any sense to talk about having age in a particular direction or plane does it. Well, to the classically trained physicist (me!) then talking about sagittal plane power doesn’t make any more sense than talking about sagittal plane age!

Or is it that simple? The quantities in physics that are related to direction are called vectors (position, speed, acceleration are common examples in biomechanics). Vectors are generally represented as a set of three number which are the components in a particular direction. Thus speed (v) is written (vx, vy, vz) with vx representing the component of speed in the x-direction. Joint power is the product of two such vectors, moment (mx, my, mz) and angular velocity (ωx, ωy, ωz) and under the laws of vector multiplication this gives the equation:

P = m.ω = mx ωx+my ωy.+mz ωy

and, although the physicist doesn’t think it has any significance, it is clear that the total power does appear to be made of three separate terms that involve quantities measured along different directions. It is these three terms that have come to be known as the “components” of power. (Notice that throughout this article I’ve put putted inverted commas around “component” when I’ve used it differently to the conventional definition in physics).

So if it is very clear what the terms mean, does it matter if we just choose to use it even if the physicists don’t think we should? I think the answer to this is “yes, it does matter” (I would though, I’m trained as a physicist). To me the whole point of biomechanics is that it allows us to understand the way the body works using rules and relationships that have been developed in the context of wider physics and engineering and which we know are true in all practical circumstances. If we start using terms which are not part of that understanding, no matter how convenient, then we lose that guarantee that they relate to each other in any particular way. It may seem sensible when you set out, but sooner or later it will lead you into trouble.

Power, in this context for example, is the amount of energy generated in a given time. The “components” of power (e.g. mx ωx ) can be negative as well as positive so if, for example, the x “component” is positive and the y and z “components” are negative, then the amount of energy generated in a given time in the x plane (if this is how it is regarded) is greater than the total energy generated in all the planes. This just doesn’t make sense. Are we saying that power is being generated at a joint in one plane at the same time as it is being absorbed in the other planes?! I hope even the non-physicists who read this can appreciate the problem.

The problem with calculating and using “components” of joint powers is that we don’t know under what other circumstances they lead us to nonsensical conclusions. Stick to the rules of physics and we know our conclusions will always be valid (as long as we’ve applied them properly of course!)

One defence of “sagittal plane joint power” which I have a little sympathy with is that, because the components of both angular velocity and moment tend to be considerably greater in the sagittal plane than others, the “sagittal plane joint power” is generally quite a good approximation to the total joint power. Given that in the modern world all these numbers just pop out of the computer anyway though its not at all clear how this is useful. If you want to know the total joint power why not calculate the total joint power? You also need to be careful that if you justify “sagittal plane power” as a good approximation to total joint power, then all you can really say about the transverse and coronal “plane powers” is that they represent the error in this approximation. Attributing physical significance to poorly defined error terms in a calculation is always going to end in tears.

In passing it may be worth commenting that kinetic energy can also be defined as a product of two vectors,

KE = ½mv.v = vx vx+vy vy.+vz vy

but I’ve never heard anyone talking of kinetic energy having components in different directions!

Normalising kinetics

There were a few things that struck me as odd when I was writing my book. Things that we’ve always done in a particular way in clinical gait analysis but which just don’t make sense. One of these is the way we typically “normalise” kinetic data by dividing through by mass only. Moments are a product of force and length and are thus likely to be influenced both by a person’s weight and their size. It just doesn’t make sense to normalise data by dividing through by weight only. There are similar, but slightly more complex, issues with joint power. Differences in adult height between individuals, expressed as a percentage, tend to be reasonably small (SD < 10%) even disregarding gender, so the effects of not normalising to height in adults are unlikely to be that important. Clinical gait analysis, however, has always had a considerable focus on children where differences in height are much larger. It just seems so obvious that we should normalise to height as well as weight. In my book I see that I actually commented, “Quite why this is not standard practice in gait analysis is unclear.”

A simple explanation may be that no-one has ever tested this assumption. So one of my colleagues (Ornella Pinzone) has performed a comparison of conventional normalisation (dividing moments and powers by mass only) and non-dimensional normalisation (dividing moments by mass and leg length and powers using a slightly more complex formula). We based it on data made available by Mike Schwartz from Gillette as their data are so well formatted for a study like this. The paper has just been published in Gait and Posture and if you use this link before 29th January then you should be able to view and download a copy of the article for free.

Pinzone

Coefficients of determination for relationship between a range of temporal, spatial and kinetic parameters and age amongst children across an age range from 4 to 18 years. Dashed line shows threshold for statistical significance at p<0.05.

The results are quite conclusive. About 80% of the associations between the conventionally normalised parameters and age, height and weight, were statistically significant (p<0.05) and for all of those parameters where the association was significant it was substantially reduced by non-dimensional normalisation (only just over 20% were statistically significant and most only marginally exceeded the p<0.05 threshold). The results have dispelled any lingering doubts in my mind as to the superiority of non-dimensional normalisation and when we next revise our normative dataset we’ll be using this as standard.

This isn’t quite the whole story, however, because even when you remove the systematic effects of height and weight (this is the primary purpose of normalisation) there is still a lot of scatter in the data. The figure below shows the relationship of peak knee extensor moment with leg length for conventional (top) and non-dimensional (bottom) normalisation. The slope on the line of regression is reduced to almost zero with non-dimensional normalisation but there is minimal effect on the scatter of data points about this line.

Pinzone2

Peak knee extensor moment plotted against leg length for conventional (top) and non-dimensional (bottom) normalisation.

It is difficult to compare this variability with that present in kinematic data because the nature of the data is so different but the impression I get is that the variability in the kinetic data is even greater than that in the kinematic data. I’ve commented in two earlier posts (here and here) that I think the assumption that we all walk similarly, an assumption on which all clinical gait analysis is based, needs to be re-examined. The most obvious conclusion from this dataset is that many of us, even in the absence of pathology, walk very differently.

Sense of satisfaction

Modern academic research is largely a rather slow process taking small incremental steps. I’ve vented my frustration before about how dispiriting it can be to get lost in a fog of low-level research projects which often leave us more confused rather than enlightened. I thus feel I want to celebrate a rare occasion when I do feel a sense of completion of a substantial programme of research.

I was lucky enough to move to Belfast  shortly after Kerr Graham and Aidan Cosgrove  had completed their early work demonstrating the efficacy of Botulinum toxin injections first in hereditary spastic mice and then in children with cerebral palsy. Kerr had departed for Melbourne by the time I arrived but left Niall Eames, an orthopaedic surgeon, lined up to do some research to try and better understand the effect of the toxin. Given that the problem in CP is that the muscles are too short and that Botulinum toxin, by reducing the neural input to the muscle, allows them to elongate, we decided that we should do this by looking at the changes in muscle length. We thus started with some, by modern standards extremely crude, muscle length modelling of the gastrocnemius.

Niall graph

Response to botulinum toxin plotted against the pre-operative dynamic component (taken from Eames et al. 1999)

Having developed the model we applied it to a cohort of children with cerebral palsy having Botulinum toxin injections and were able to demonstrate that the action of the toxin was to reduce the “dynamic component” of reduced muscle length (see figure above). This makes a lot of sense as it is this component that is affected by the neural input to the muscle. The “fixed component” (contracture) is largely a consequence of changes to the composition and structure of the muscle and is unlikely to be affected by the toxin. The research also allowed us to understand that the variable response was largely due to children having a different dynamic component rather than of the toxin acting differently and led to reasonably simple prescription guidelines. Botulinum injections to the calf are most likely to be beneficial if the child has a large dynamic component (good range of passive dorsiflexion during physical examination but walking up on their toes). It further explained that the different response in children with diplegia  and hemiplegia was also attributable to them having different magnitudes of dynamic component.

Armed with this understanding I was then able to work with the pharmaceutical company Ipsen to set up a cliniucal trail to establish the most appropriate dose of the toxin. We couldn’t find enough children to study in the UK so had to extend the study to five centres in Poland. We divided children into one of four groups and injected them with either a placebo or one of three different doses. We used the same modelling technique which we had developed for the earlier study to analyse the results and came to  the conclusion that placebo didn’t work (very much) and that the middle dose was the most effective (see figure below). It was interesting that the biomechanical modelling came to clear logical conclusions whereas doctors’ subjective opinions were that the placebo was very nearly as effective as the drug and that they were so impressed by the “improvement” after placebo injection that they would have recommended repeating the process for two thirds of the children! (despite biomechanical evidence that the placebo had had no effect).

Baker graph

Reduction in dynamic component as a function of different doses of Botulinum toxin at 4, 8 and 16 weeks (Baker et al. 2002)

Having established the most appropriate dose on a single occasion the most obvious remaining question is, “How often should those injections be repeated?”. I’d moved to Melbourne to join Kerr by then and we applied to the Australian National Health and Research Council to fund a clinical trial to compare injections delivered either annually or every four months over a  two year period. Reflecting on the biomechanics we recognised that the long term goal of the injections had more to do with preventing the development of secondary fixed contractures than on the immediate effect on the dynamic component. We would have to measure relatively small changes over a two year time span and thus devised a method to standardise the measurement of passive dorsiflexion range as much as possible.

Which brings me to the stimulus for writing this post in that the results of that study have just been published . The first conclusion is that passive range of dorsiflexion was maintained over the two year period by both injection regimes. We had no true control, because by this stage it wasn’t considered ethical to inject placebo over such a long period, but these measurements were taken over an age range in a child’s life during which preserving dorsiflexion range would be extremely unlikely without injections. The second conclusion was that the more regular injections where only slightly more effective in preserving dorsiflexion range and therefore that there doesn’t appear to be any particular benefit in injecting more regularly than once a year.

Thus after nearly twenty years of research based on the application of thoughtful biomechanics to a clinical problem we finally have clear evidence of which children to inject, how much toxin to inject and how often to repeat this. As one leader of the western world was once heard to comment under less auspicious circumstances, “Mission accomplished!”

Footnote

Trials like this take so long to organise that we were not actually the first group to complete a study to establish the most appropriate injection frequency. This was actually published about 5 years ago. It was a very similar study (it had been sponsored by Ipsen as a follow-on our to earlier work and I’d had some involvement in its planning before I left for Australia) and arrived at a very similar result. Rather than feeling that there was competition here though it highlights the scientific importance of repeating studies to confirm results. With such an emphasis on innovation in modern clinical research the need to repeat and confirm earlier results, which is an important part of the scientific process, can very often be overlooked.