During a meeting of the CMAS standards meeting last week there was some discussion about how repeatable our measurements need to be. I was struck by a comment from Rosie Richards from the Royal National Orthopaedic Hospital at Stanmore that six degrees is the angle represented by one minute on a clock (apparently the idea originally came from her colleague Matt Thornton). Her point was that this doesn’t feel like a very big angle and that if we are are working to this sort of accuracy then we are doing pretty well. I’d agree with her and think if there is ever any discussion of just how accurate gait analysis is then using this as an illustration is really powerful.

Corn Exchange clock, Bristol. This clock actually has two second hands. The red one records GMT and the black one the local time in Bristol which is 190 km west of London and thus nine seconds behind! (C) Rick Crowley, Creative commons licence.
The evidence supports this. In our systematic review, Jenny McGinley and I suggested that measurement variability of more than 5 degrees was concerning and showed that most repeatability studies for most joint angles report variability of less than this. They are thus also, of course, within the one minute limit as well.
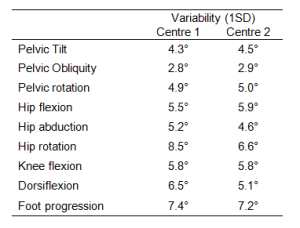
It’s also interesting to note that the variability within normal gait is generally less than 6 degrees. I’ve tabulated the standard deviations from our recent comparison of normative data below. Hip rotation at one centre pushes above the limit (but this is almost certainly a consequence of measurement error). The only other variable that exceeds this is foot progression (which I’ll return to below). This should be of interest to those who think that they should be able to use differences in gait pattern as a biometric to identify people. To do this successfully would require variability within the 1 minute limit to distinguish between people. Personally, I think this is a big ask from the CCTV camera footage that the biometricians would like to base their analysis upon.
This doesn’t mean we should be complacent, however. In the figure below I’ve compared Verne in the average normal pose at the instant of foot contact (grey outline) and then increased his leading hip flexion by 6 degrees (and adjusted the trailing foot pitch to bring the foot into contact with the ground again while all the other joint angles remain the same). You can see that this has increased step length by over 10%. If there was an additional 6 degree increase in trailing hip extension as well then this would double. The additive effect of such variability may help explain why foot progression in the table above is a little higher than the other measures in that it can be considered as a combination of the transverse plane rotations at pelvis, hip, knee and ankle rather than a “single” joint angle.

In summary the one minute limit seems an extremely useful way of describing how accurate our measurement systems are and we should take considerable confidence from this. On the other hand we shouldn’t be complacent as variability of this level in specific joint parameters can have quite substantial impacts on the biomechanics of walking.
Readers outside the UK may not fully appreciate the title to this blog which is a reference to one of the oldest comedy shows on BBC radio which has been broadcast regularly since 1967. It is one of the purest and most exuberant celebrations of the English language that I know. Episodes are not being broadcast at present but when they are they can be listened to internationally (I think) through the BBC i-player.

Hi Richard
The analogy of the clock face was originally derived in connection with eyeballing range of motion while doing a static examination. The idea was to imagine the clock face with the joint at the centre as the limb segment is moved. I still teach this technique now – it works well and I think having a common conceptual frame work has helped improve the teams inter-rater reliability. For example if we measure hip flexion in supine the thigh starts out at 3 O’clock. If we can get it upright to 12 O’clock that’s obviously 90 degrees of movement, 11 O’clock adds another 30 degrees and so on. Because of the familiarity of the clock face the 30 degree increments are very familiar. With a bit of practice we feel that we can judge the mid positions between the number giving us 15 degree increments, 45 degrees is particularly easy to recognise. To get to 5 degree increments you have to use gut feeling to either leave the reading as is, nudge it down by 5 degree or nudge it up by 5 degrees.
Many clinicians seem confident that they can measure range of motion to 5 degree increment level of accuracy either by eye or with a goniometer. However, if I ask them if they could tell the difference between say 5 minutes past the hour or 6 past the hour just by the position of the hands on an un-marked clock face, they seem less sure. This is interesting because the range of motion estimate involves a 3D joint with poor information about the true rotation centre, where as the clock face is a 2D structure with the centre of rotation clearly given – so you’d think it would be the other way around?