I’ve had some feedback from Vicon support that people have been asking them how to calculate what I’ve called projection angles on page 138 of my book. These are graphs that look a bit like joint kinematics but represent how each of the segments is aligned with respect to the global axis system rather than to the proximal segment. Two of the femur projection angels thus show how the long axis of the femur is tilted with respect to the vertical in the global sagittal and coronal planes. The third angle shows how the femur is rotated about this axis (projected onto the transverse plane).
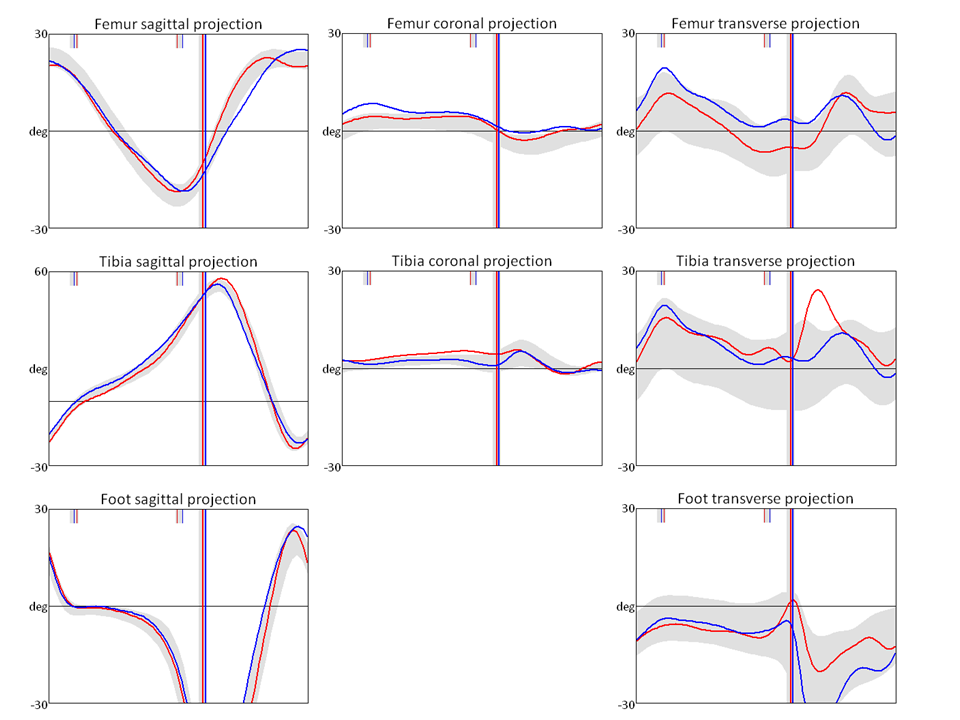
I first plotted these graphs as a quality assurance tool in that they represent what you should see on a video recording of the person walking (as long as you take into account parallax effects if the person is not in the centre of the screen or the camera is not directed exactly along one of the principal axes of the global coordinate system). Thus the femur transverse projection tells you whether you should be seeing the femur as internally or externally rotated as viewed by a camera towards which the person is walking. It avoids the need to perform a mental sum of pelvic rotation and hip rotation to assess which is required otherwise. In the example above, at foot contact the left thigh (red) is facing directly ahead and the right thigh is internally rotated by about 5°. You probably won’t be see such a small difference but if the right limb looked to be externally rotated at this instant you might want to question the alignment of thigh markers or knee alignment devices.
Since starting to plot the angles, however, a range of other uses have emerged. The tibia and femur sagittal projections, for example, are essentially what Elaine Owen refers to as segment to vertical angles when tuning ankle foot orthoses.
The foot transverse plane angle is what many of us already plot out routinely and call foot progression. The corresponding angle in the sagittal plane, however, is very rarely plotted but gives a direct appreciation of whether the foot is flat or not. In the example above the foot makes contact at an angle of about 15° to the ground and rotates to become flat on the floor (0°) during about the first 8% of the gait cycle (Perry’s heel rocker). It then remains flat until about 40% of the gait cycle (ankle rocker) after which heel rise causes the foot to start tilting forwards (negative angle, representing toe rocker). If distinguishing between the rockers is important to you then using a graph like this is about the only way to do it. I’ve referred in a previous post to how useful I find this information can be.
I’ve not plotted the pelvic graphs because, if you calculate them using the correct rotation sequence, then they are virtually identical to the pelvic joint angles.
The main reason for this post is thus to make the model that I wrote many years ago to calculate this widely available (click here to go to the download page). Unfortunately it is written in Vicon’s BodyLanguage so will only be directly useful for Vicon users (please note that it requires plugin Gait to have been run first). The accompanying description of exactly what the angles represent should, however, allow any reasonably competent clinical engineer to calculate the equivalents in any other programming/modelling language.

One comment